Weather Sensors - The Unsung Heroes of Solar Performance (Part 1 of 2)


Key Takeaways
- Weather sensors answer two fundamental questions: "Is my site performing as it should?" and "Am I meeting my financial obligations?"
- Must-have sensors measure back-of-module temperature and plane-of-array irradiance, while nice-to-haves like wind speed and precipitation sensors are typically reserved for larger projects.
- Wattch recommends the minimum instrumentation needed for accurate performance modeling, covering IEC 61724-1:2021 Class B requirements without the cost burden of over-engineering.
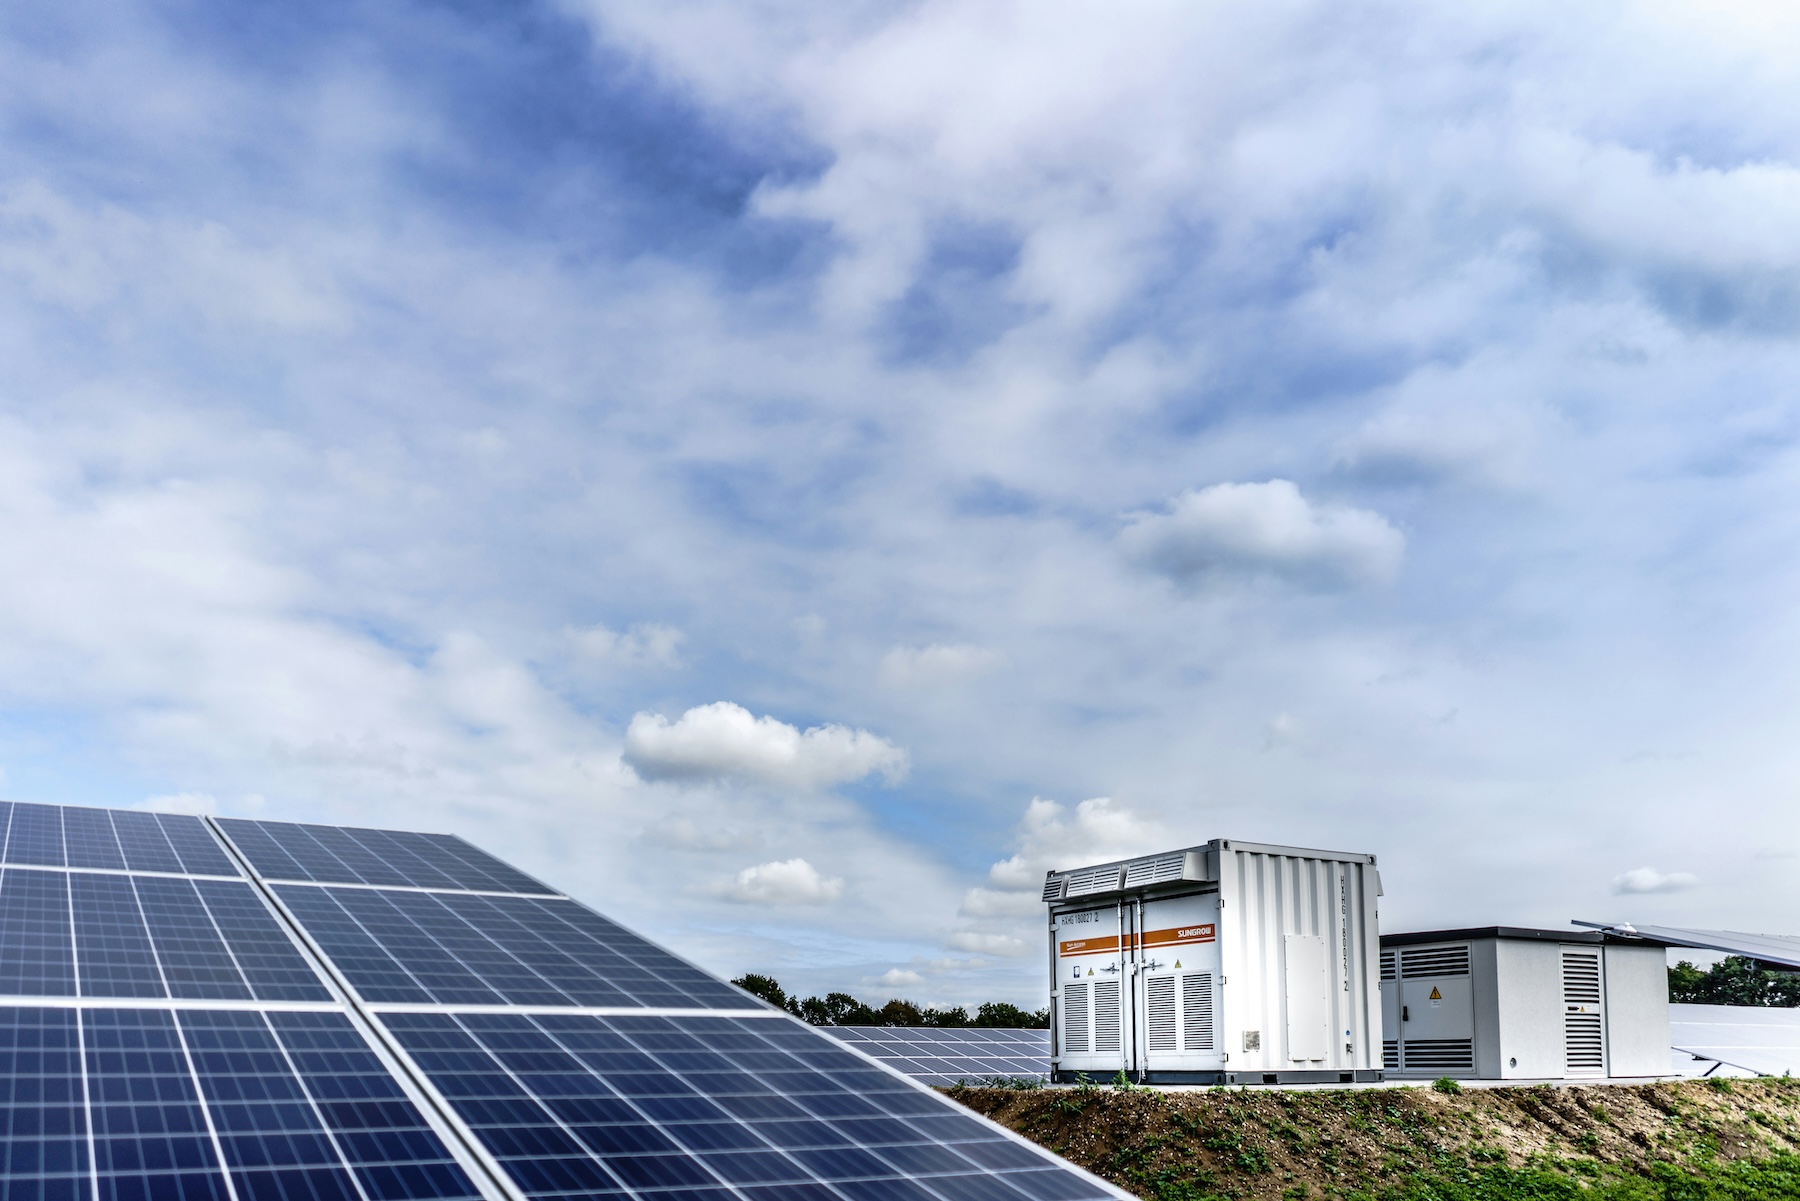
Weather sensors sit alongside inverters, combiner boxes, and other balance-of-system components on every well-instrumented commercial and industrial (C&I) and distribution-scale solar site. Without accurate meteorological data, you can't answer the most fundamental questions about your solar asset’s performance.
At Wattch, we've spent years helping operators understand which sensors they actually need and which ones are expensive overkill. In this post, we'll break down the purpose of weather sensors, the different types available, and our philosophy on right-sizing instrumentation for your solar fleet.
The Two Questions Every Sensor Must Answer
Every sensor on a solar site exists to help answer one of two critical questions.
The first question is operational: Is my site performing as it should? This is what your operations and maintenance (O&M) team cares about. They need to know when to roll a truck, when something needs repair, and whether they are leaving money on the table. On cloudy or rainy days, production will naturally drop, as shown by a low Energy Performance Index (EPI). But without weather data, there's no way to distinguish between unavoidable weather-related losses and resolvable equipment issues.
The second question is financial: Is my site performing as well as I predicted during design? Banks and developers financing solar projects need to know whether they're getting the return on investment they modeled. During project development, tools like PVsyst or Helioscope simulate production based on Typical Meteorological Year (TMY) data (historical weather averages). When actual production deviates from those predictions, as shown by a low Baseline Energy Performance Index (BEPI), investors need to understand whether the variance is due to weather differences or system underperformance.
Both questions require the same thing: accurate, real-time meteorological data that can be compared against actual system output.
The Must-Haves
Not all weather data is created equal. Some parameters are essential for performance modeling, while others are nice-to-haves that often only make sense for larger installations. Let's start with the essentials.
Irradiance
Irradiance is the single most important input for performance modeling. The power output of a PV system is proportional to the irradiance hitting the modules, so accurate measurement provides the foundation for calculating expected production.
It's worth understanding the different irradiance measurements you'll encounter:
Global Horizontal Irradiance (GHI) is the total irradiance falling on a horizontal surface, or the sum of direct sunlight and diffuse sky radiation.
Direct Normal Irradiance (DNI) is the irradiance from the sun itself, measured perpendicular to the sun's rays.
Diffuse Horizontal Irradiance (DHI) is everything except direct sunlight, or the scattered light from the sky, clouds, and atmosphere.
Plane-of-Array (PoA) is the effective irradiance hitting your actual modules at their installed tilt and azimuth. This value matters most for modeling production.
Reverse Plane-of-Array (RPoA) is the irradiance hitting the back side of bifacial modules. This is primarily relevant for ground-mount bifacial installations where reflected light from the ground contributes meaningfully to production.
For most sites, the two irradiance measurements that matter are PoA and GHI. Plane-of-array irradiance, measured at the same tilt and azimuth as your modules, provides the most direct input for performance calculations.
Irradiance Sensor Types
Not all irradiance sensors work the same way, and the differences matter for accurate performance modeling.
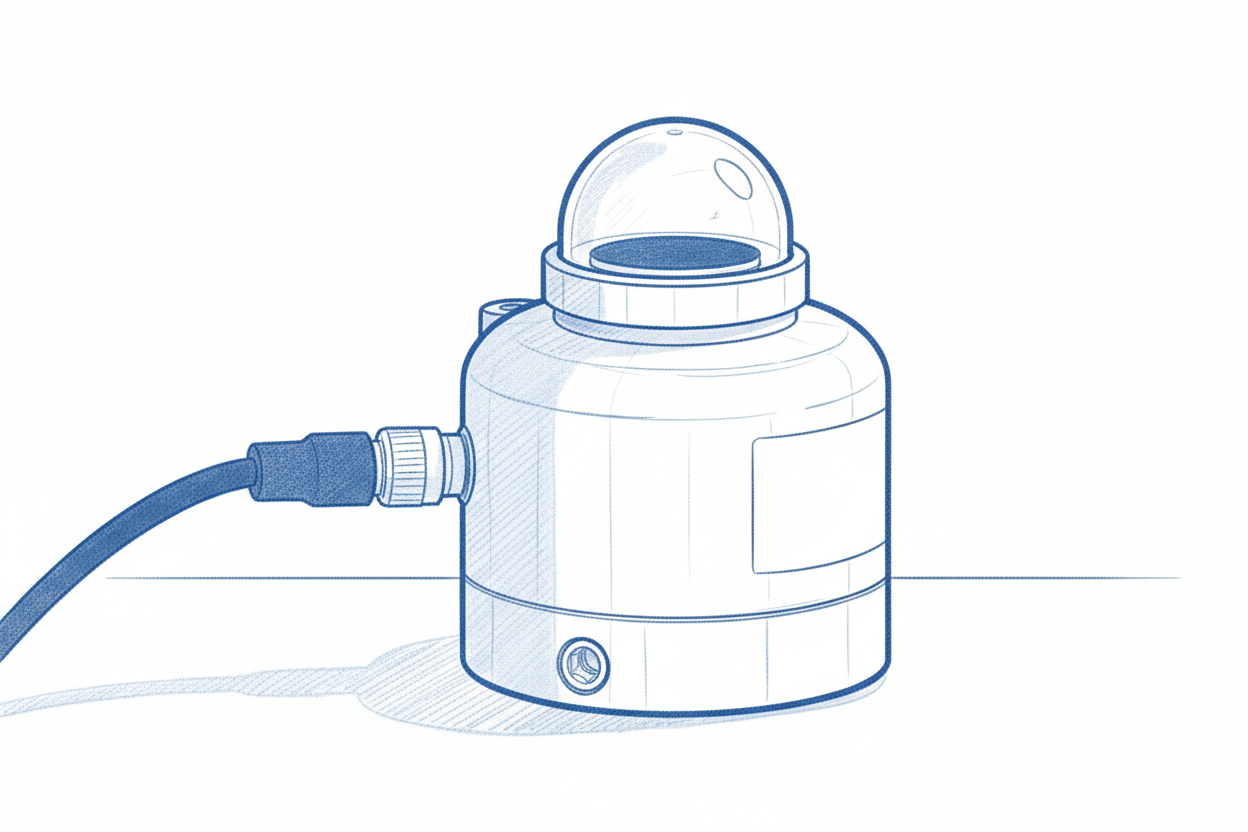
Thermopile Pyranometers
When most people in the solar industry say "pyranometer," they're referring to thermopile pyranometers. These instruments use a precisely characterized thermopile (a well-calibrated rock) that heats up when exposed to sunlight and produces a proportional voltage.
Thermopile pyranometers measure the full solar spectrum, from ultraviolet through infrared. This "broadband" response is why they're often referenced in research.
The challenge is that solar cells don't respond to the full spectrum. Silicon PV modules only convert a portion of the solar spectrum into electricity, roughly from 300 to 1100 nanometers, with peak response in the visible range. This means a thermopile pyranometer will "see" energy that the solar modules can't use, potentially overestimating expected production.

Silicon Reference Cells
Silicon reference cells are miniature, precisely calibrated solar cells. Instead of measuring heat absorption like a thermopile, they measure the same photovoltaic effect that your actual modules use to generate power.
The key advantage is spectral matching: a silicon reference cell responds to roughly the same wavelengths as the silicon modules on your roof. If clouds filter out certain wavelengths, or atmospheric conditions shift the spectrum, the reference cell and your modules are affected similarly. This tends to produce more accurate expected production calculations, particularly on days with variable or overcast conditions.
A common question is whether you can just apply a fixed correction factor to pyranometer readings to account for the spectral mismatch. Unfortunately, it's not that simple. The solar spectrum changes throughout the day, seasonally and with atmospheric conditions. Morning and evening light has a different spectral composition than midday sun. Cloudy skies filter wavelengths differently than clear skies. The "air mass" (the path length through the atmosphere) affects which wavelengths reach the ground.
Some spectral correction is possible and is applied in sophisticated models, but it can only get you within about 2% to 3% accuracy. For many sites, that's perfectly acceptable. For sites where every fraction of a percent matters, matching the sensor response to the module response provides an inherent advantage.
Reference cells also have much faster response times than thermopile pyranometers (milliseconds versus the 10+ seconds needed for a thermopile to reach thermal equilibrium). For high-resolution performance analysis, this responsiveness can be valuable.
As of 2021, the IEC 61724-1 standard recognizes silicon reference cells as Class A instruments, putting them on equal footing with the best thermopile pyranometers for formal performance measurement.
However, for sites with multiple orientations, installing a reference cell for every plane can get expensive. An alternative approach is to install a single pyranometer to measure GHI and use modeling to transpose that measurement into PoA values for each orientation. With knowledge of the sun’s position, system geometry and some physics, we can decompose GHI into its direct and diffuse components and then transpose those values to any plane of array. This transposition introduces some additional uncertainty compared to direct PoA measurement, but for many sites, the cost savings justify the accuracy trade-off.
Satellite Irradiance: A Viable Alternative
For smaller sites where on-site sensor installation costs are prohibitive, satellite irradiance data offers a compelling alternative. Satellite irradiance services use imagery from geostationary satellites combined with atmospheric models to estimate ground-level irradiance. The data is typically available at between 5-minute and 30-minute resolution across the entire coverage area, with no on-site installation required.
The Accuracy Trade-Off
Satellite data works well for clear-sky days. The algorithms are quite good at modeling direct sunlight based on solar position and atmospheric conditions.
The challenge is clouds. Satellites can't directly observe conditions underneath cloud cover, and the spatial resolution, typically a few kilometers per pixel, means your specific site might be fully shaded while the satellite sees partial clouds, or vice versa.
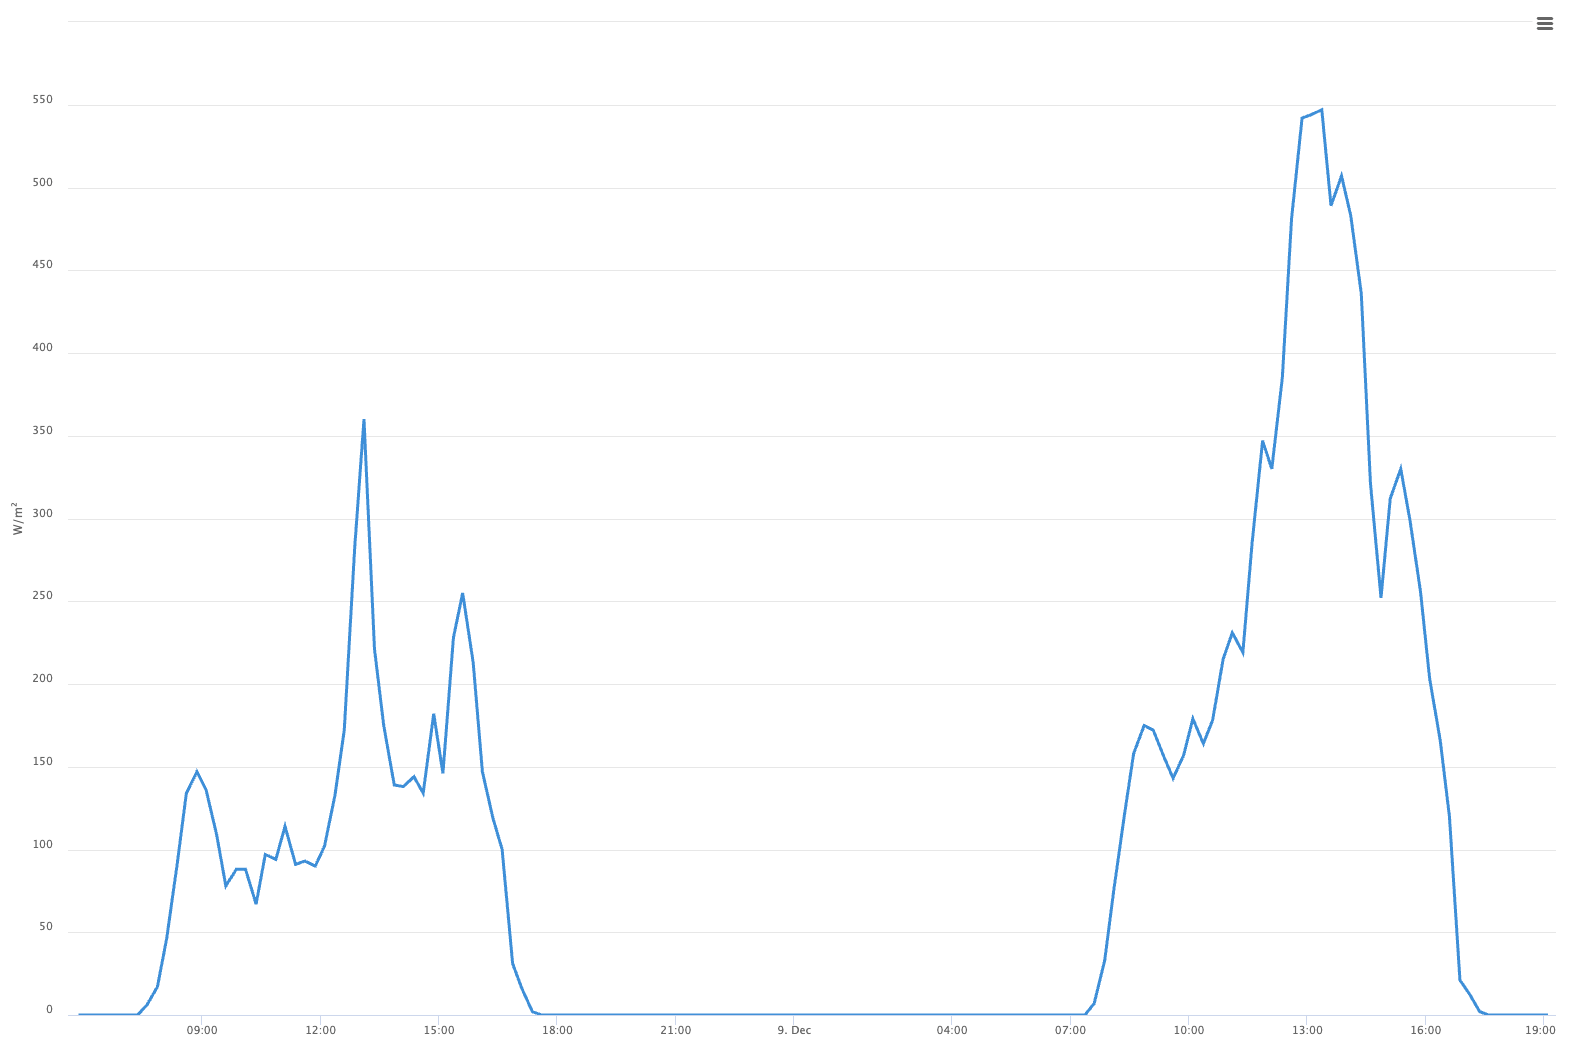
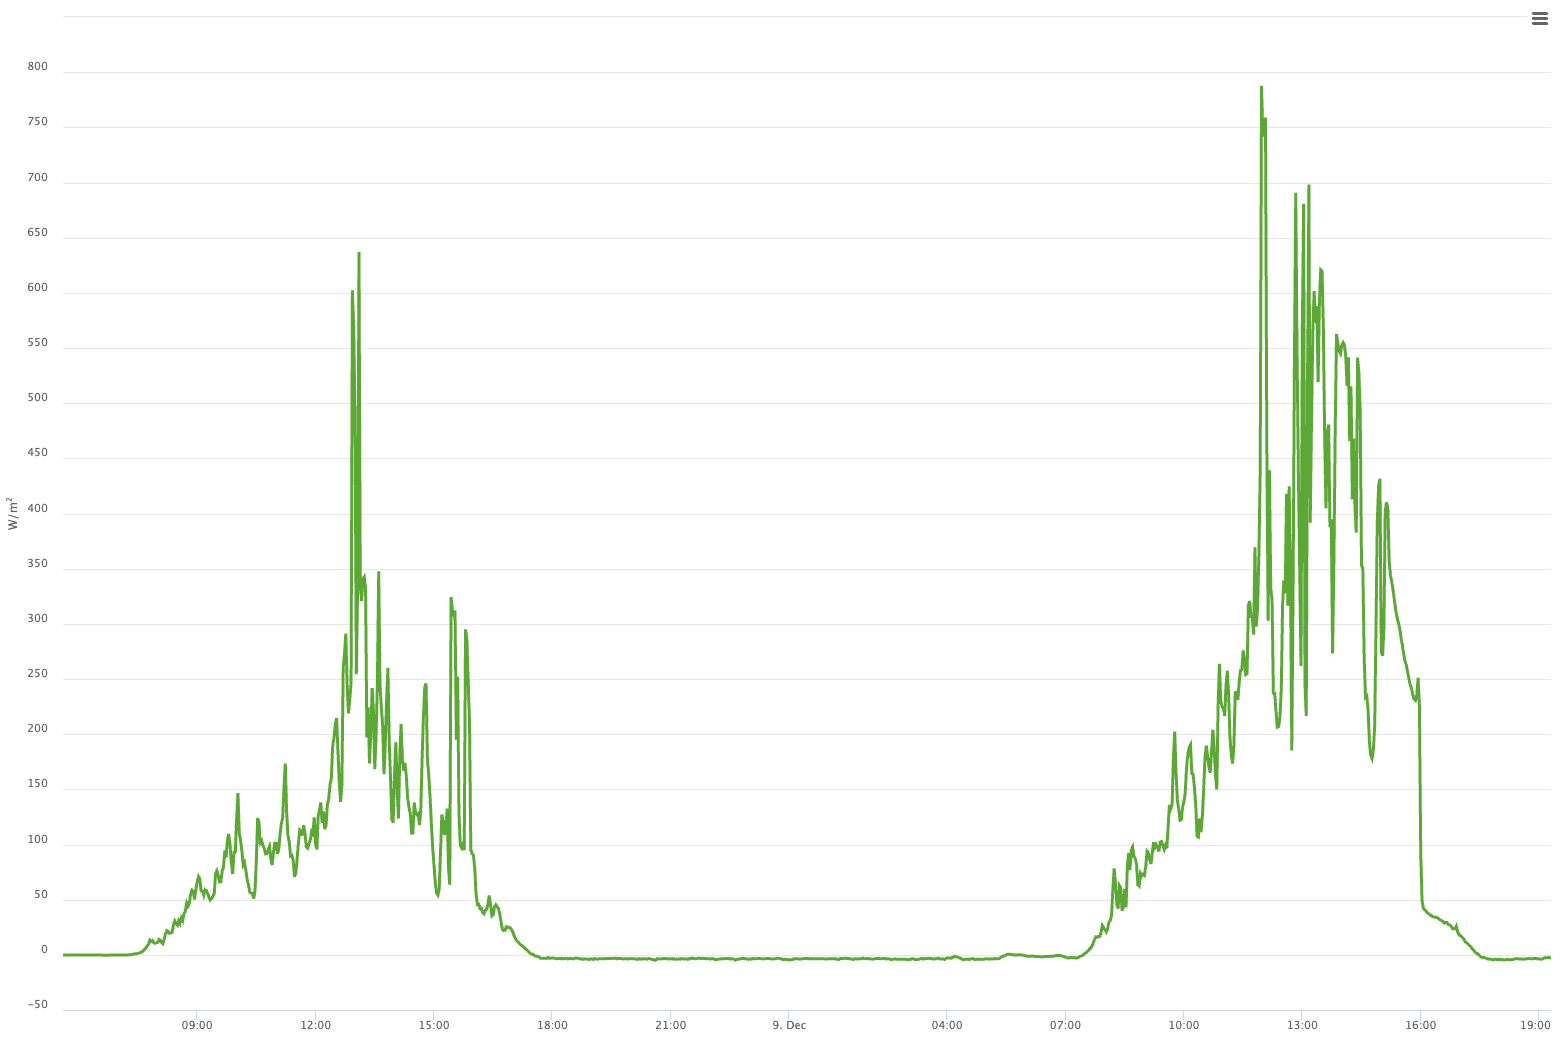
In our experience, satellite irradiance data is accurate to about 3% to 5% on a monthly basis. On a daily basis, the error bounds are around 20%. Side-by-side comparisons with on-site sensors show this clearly: clear days track closely, while cloudy days show significant smoothing and estimation errors.
When to Use Satellite Data
Satellite data is best for monthly production reporting, where 3% to 5% error bounds are reasonable. However, this data isn’t useful for running advanced analytics that rely on tight temporal accuracy, like Wattch’s string health analysis tool.
You can also use satellite data in addition to meteorological equipment as a backup when sensors fail. If your primary irradiance sensor goes offline, switching to satellite data lets you continue monitoring performance rather than flying blind.
Finally, comparing satellite data against your on-site sensor is a useful diagnostic. If the two measurements diverge over time, it might indicate sensor drift or soiling. If they're consistently offset, it might indicate a sensor calibration issue.
Temperature
Temperature measurement is critical because PV module performance degrades as cells heat up. The physics are straightforward: as temperature increases, the band gap of the silicon cells decreases, which reduces voltage and, consequently, power output. As a rule of thumb, module performance drops by 0.3% to 0.5% for every degree Celsius above the 25°C standard test condition.
Back-of-module (BoM) temperature sensors are typically small thermocouples or resistance temperature detectors (RTDs) attached directly to the rear surface of a module. They provide the most accurate estimation of what the cells are actually experiencing.
For sites with multiple array configurations (orientation, placement, etc.), you might wonder whether you need a BoM sensor for each plane. That depends. If the orientations are similar enough, a single sensor can work. But for sites with significantly different tilts or azimuths, each array may operate at a different temperature (for example, due to the differing effects of wind) and a single sensor may not be representative of the whole system.
In this case, an ambient temperature sensor can be used alongside sophisticated modeling to calculate the temperature of each array. However, if your digital twin is not capable of modeling back-of-module temperature from ambient temperature with a high degree of accuracy, you will need a sensor for every orientation.
When direct measurement isn't practical or cost effective, we recommend the Sandia Module Temperature Model to estimate cell temperature from ambient temperature, plane-of-array irradiance, and wind speed. It's remarkably accurate for most C&I deployments and far simpler than the more academic transient thermal models.
Nice-to-Haves
Beyond the essentials, larger sites may benefit from measuring additional meteorological parameters. For example, air pressure and humidity are used in some transposition models to estimate atmospheric refraction and scattering. Wind speed and direction affect module temperature and can be useful for sites in particularly windy locations. Precipitation levels can help correlate production dips with weather events and inform soiling analysis.
These parameters are typically measured via dedicated weather stations, which are compact all-in-one units that capture multiple readings. For most C&I sites, however, we recommend simply pulling these values from satellite-derived sources rather than installing on-site equipment. The added accuracy rarely justifies the cost for sites under a few megawatts.
This is because, while irradiance changes rapidly throughout the day and has a significant, direct and immediate impact on plant production, parameters like humidity and air pressure change slowly and don’t impact output to the same extent. And while wind speed and direction can change quickly, they have a slow impact on module temperature, which is what matters for output.
How Other Companies Select Sensors (And Why We Disagree)
We've seen a lot of sensor specifications over the years, and there's a consistent pattern: many providers are incentivized to over-specify.
When your business model involves selling hardware at a markup, there's a natural temptation to recommend more equipment than strictly necessary. We've seen designs for 250 kW rooftop systems that include Class A pyranometers, instruments originally designed for research-grade solar resource assessment. These sensors are often used on utility-scale plants where every fraction of a percent of lost production translates to significant revenue.
For single-orientation C&I systems, we’ve found that a single reference cell and BoM temperature sensor provide greater accuracy than a Class A pyranometer and weather station that includes wind direction, wind speed, and ambient temperature, and at a small fraction of the overall cost.
How Wattch Selects Sensors
Our philosophy is simple: minimum instrumentation for maximum insight.
For the smallest systems, we typically rely on satellite irradiance data rather than on-site sensors, because the economics don't justify installation costs. For most C&I sites, we add on-site irradiance and temperature sensors appropriate to the site configuration.
For sites with a single orientation, a PoA-mounted reference cell paired with a BoM temperature sensor is often sufficient. For sites with multiple orientations, a GHI-mounted pyranometer with an ambient temperature sensor allows the model to handle the transposition math for each orientation. For larger systems and those with bifacial modules, we add redundancy and bifacial-specific measurements where appropriate.
Throughout, our recommendations meet IEC 61724-1:2021 Class B requirements for performance measurement. Class A is impressive on paper, but the requirements, such as five-second sampling, calibration every two years and multiple BoM sensors per station, add significant cost without proportional operational benefit for most C&I and distribution-scale sites.
The Bottom Line
Weather sensors may not be the most glamorous part of a solar installation, but they're essential for answering the questions that matter, such as “Is this site healthy?” and “Is this site hitting its financial targets?”
The right sensor specification balances accuracy against cost, matching the instrumentation to the site's size and complexity. For most commercial solar projects, that means fewer sensors than you might expect. However, the right sensors, properly installed and integrated with your performance model, can make the most of the data they provide.
In Part 2 of this series, we'll dive into the analog versus digital sensor debate, accuracy standards, and the practical considerations of sensor placement and robustness.
For information about optimizing your solar monitoring with the right sensor configuration, contact us at hello@wattch.io.


